| P of F (CPL) Study Tracker | – | | Not Viewed | |
| 22.2.2 Units of measurement. State; | – | | Not Viewed | |
| 22.2.4 Scalar and Vector quantities | – | | Not Viewed | |
| Speed, velocity and acceleration | – | | Not Viewed | |
| the factors affecting centripetal force and rate of turn. | – | | Not Viewed | |
| 24.4.8 Describe the International Standard Atmosphere. | – | | Not Viewed | |
| 24.4.10 State the ISA sea level pressure and temperature conditions, | – | | Not Viewed | |
| Newton’s three laws of motion | – | | Not Viewed | |
| Trigonometry functions | – | | Not Viewed | |
| 24.4.12 Describe the approximate altitude bands in which atmospheric | – | | Not Viewed | |
| 24.4.16 Explain the term viscosity, when related to air. | – | | Not Viewed | |
| Motion on a curved path | – | | Not Viewed | |
| Moment / Couples | – | | Not Viewed | |
| 22.6.2 Describe the terms freestream static pressure, dynamic press | – | | Not Viewed | |
| 22.6.10 Bernoullifs theorem | – | | Not Viewed | |
| 22.6.16 Explain the terms upwash and downwash in an airflow. | – | | Not Viewed | |
| Flip Cards | – | | Not Viewed | |
| 22.10.4 Explain the term boundary layer. | – | | Not Viewed | |
| 22.10.22 Describe typical curves of induced drag, all other drag, and | – | | Not Viewed | |
| Equilibrium | – | | Not Viewed | |
| Centre of Gravity | – | | Not Viewed | |
| Work, Power and Energy | – | | Not Viewed | |
| Simple Graphs | – | | Not Viewed | |
| Lift Augmentation | – | | Not Viewed | |
| 22.12.2 Explain the basic purpose of lift augmentation devices. | – | | Not Viewed | |
| 24.4.2 Define air density. | – | | Not Viewed | |
| 24.4.4 Describe the effect of temperature, pressure and humidity on | – | | Not Viewed | |
| 24.4.14 Explain the meaning of density altitude (DA) and, in broad t | – | | Not Viewed | |
| 22.6.6 With respect to aerofoils, describe the meanings of the foll | – | | Not Viewed | |
| 22.12.4 Explain the basic principles of trailing and leading-edge devices | – | | Not Viewed | |
| 22.12.16 Explain the effect of operating leading-edge slats on CL, stalling angle and nose attitude | – | | Not Viewed | |
| 22.14 Flight Controls | – | | Not Viewed | |
| 22.16 Stalling and Spinning | – | | Not Viewed | |
| 24.4.6 Describe the normal changes in pressure, temperature and den | – | | Not Viewed | |
| 22.6.7 Distinguish between high-lift, general purpose (GP) and high-speed aerofoil sections | – | | Not Viewed | |
| 22.16.10 Explain the standard recovery from the stalled condition. | – | | Not Viewed | |
| 22.16.14 Describe the conditions which encourage a wing-drop at the stall. | – | | Not Viewed | |
| 22.18.2 Explain the four forces acting and the conditions required for steady straight and level flight | – | | Not Viewed | |
| 22.18.6 Explain the power and attitude relationships at various airs | – | | Not Viewed | |
| 22.6.4 Explain the principle of airspeed indication, and indicate t | – | | Not Viewed | |
| 22.6.8 Define relative airflow and angle of attack (). | – | | Not Viewed | |
| 22.22.2 Explain how the required turning (centripetal) force is generated | – | | Not Viewed | |
| 22.22.4 Define load factor. | – | | Not Viewed | |
| 22.22.6 Describe how load factor increases with bank angle. | – | | Not Viewed | |
| 22.6.12 Describe a venturi and explain venturi effect. | – | | Not Viewed | |
| 22.6.14 Explain the changes to the airflow and pressure distribution around a typical aerofoil in a low- subsonic speed airflow as is increased from the zero-lift angle to beyond the stalling angle. | – | | Not Viewed | |
| 22.6.18 Explain the term centre of pressure (CP); and describe typic | – | | Not Viewed | |
| 22.6.20 Define the total aerodynamic reaction force (TR) of an aerofoil | – | | Not Viewed | |
| 22.22.18 Describe the forces acting during a manoeuvre in the looping plane | – | | Not Viewed | |
| 22.6.22 Describe how TR varies with increasing angle of attack (). | – | | Not Viewed | |
| 22.6.24 Define the TR components lift and drag. | – | | Not Viewed | |
| 22.8.2 Identify the factors affecting lift (low-subsonic speed airflow) | – | | Not Viewed | |
| 22.8.4 State the lift formula, and the three basic functions contai | – | | Not Viewed | |
| 22.24.18 Describe asymmetric blade effect. | – | | Not Viewed | |
| 22.24.20 Explain the terms power absorption and propeller solidity. | – | | Not Viewed | |
| 22.26.4 Differentiate between stability and controllability. | – | | Not Viewed | |
| 22.26.10 Define lateral stability and explain the factors affecting i | – | | Not Viewed | |
| Sweep-Back / Lateral Stability | – | | Not Viewed | |
| 22.8.6 Describe the meaning of the term, coefficient of lift (CL). | – | | Not Viewed | |
| 22.8.8 Given a typical CL versus Angle of Attack curve for a GP-type aerofoil, i | – | | Not Viewed | |
| 22.8.10 Explain the meaning of a high CLmax. | – | | Not Viewed | |
| 22.8.12 With respect to the CL curve, describe the effect of: | – | | Not Viewed | |
| 22.8.14 Describe three-dimensional flow over a wing and explain how | – | | Not Viewed | |
| 22.26.16 With respect to stability and control on the ground, explain | – | | Not Viewed | |
| 22.28.4 Explain the factors affecting yawing and rolling moments. | – | | Not Viewed | |
| 22.28.8 Recall immediate actions and techniques for identifying the | – | | Not Viewed | |
| 22.30.2 Define specific air range (SAR) | – | | Not Viewed | |
| 22.30.2 Define Specific Fuel Consumption (SFC) | – | | Not Viewed | |
| 22.32.2 Define: | – | | Not Viewed | |
| 22.8.16 Explain the effect of induced downwash on α | – | | Not Viewed | |
| 22.8.18 Define aspect ratio (AR) and describe the effect of AR on CL | – | | Not Viewed | |
| 22.10.2 Identify and explain the components of total drag. | – | | Not Viewed | |
| TODA, TORA, ASDA | – | | Not Viewed | |
| Drift down | – | | Not Viewed | |
| 22.10.6 Describe: Airflow over a wing in terms of layers | – | | Not Viewed | |
| 22.10.8 Explain skin-friction drag and state the factors affecting i | – | | Not Viewed | |
| 22.10.10 Explain form drag and state the factors affecting it. | – | | Not Viewed | |
| 22.10.12 Describe the effect of streamlining in reducing form drag. | – | | Not Viewed | |
| 22.10.14 Describe interference drag and the measures for reducing it. | – | | Not Viewed | |
| 22.10.18 State the meaning of the term coefficient of drag (CD); and describe the main features | – | | Not Viewed | |
| 22.10.16 Explain the origin of induced drag; and | – | | Not Viewed | |
| 22.10.20 State the drag formula, and the three basic functions contai | – | | Not Viewed | |
| 22.10.24 From information provided or a diagram identify the speed fo | – | | Not Viewed | |
| 22.10.26 Distinguish between graphs for CD and total drag. | – | | Not Viewed | |
| 22.10.28 Explain a typical graph for lift/drag (L/D) ratio versus α | – | | Not Viewed | |
| 22.10.30 Explain from a typical graph the most efficient angle of attack, zero lift position and the stalling angle. | – | | Not Viewed | |
| Drag vs Induced Airspeed GRAPH | – | | Not Viewed | |
| 22.12.8 Distinguish between the effects of lowering leading-edge flap on angle of attack, nose attitude and movement of CP with those of trailing-edge flap | – | | Not Viewed | |
| 22.12.6 Explain the effects of lowering trailing edge flap on; CL, CD, L/D ratio, CP movement, angle of attack and nose attitude | – | | Not Viewed | |
| 22.12.10 Given a description or diagram identify the main types of trailing-edge flap and compare their relative performance | – | | Not Viewed | |
| 22.12.12 Given a description or diagram identify the main types of leading-edge flap | – | | Not Viewed | |
| 22.12.14 Explain the basic principles of slats and slots. | – | | Not Viewed | |
| 22.12.18 Show understanding of the theory of spoilers and give example of their use | – | | Not Viewed | |
| 22.14.2 Identify the three aircraft axes, movement about those axes, | – | | Not Viewed | |
| 22.14.4 Explain how control in pitch, roll, and yaw is achieved. | – | | Not Viewed | |
| 22.14.6 Identify and explain: | – | | Not Viewed | |
| 22.14.8 Describe the effects of airspeed and slipstream on control effectiveness | – | | Not Viewed | |
| 22.14.10 Explain the basic principles of trim tabs, and describe the correct method of using trim controls | – | | Not Viewed | |
| 22.14.12 Explain the reason for aerodynamic balancing of control surf | – | | Not Viewed | |
| 22.14.14 Describe the main methods for achieving control balance. | – | | Not Viewed | |
| 22.14.16 Differentiate between a balance tab and an anti-balance tab. | – | | Not Viewed | |
| 22.14.18 Explain the purpose for mass balancing. | – | | Not Viewed | |
| 22.14.20 Describe and explain flexural and torsional flutter. | – | | Not Viewed | |
| 22.14.22 Describe the methods of providing mass balance. | – | | Not Viewed | |
| 22.16.2 Explain the stalled condition of an aerofoil. | – | | Not Viewed | |
| 22.16.4 Explain basic stall speed and relate it to the lift formula. | – | | Not Viewed | |
| 22.16.6 Describe typical symptoms and other indications of the approach to the stall. | – | | Not Viewed | |
| 22.16.8 Describe the changes in the airflow over the wing, movement of the CP, and aircraft attitude as the point of stall is reached. | – | | Not Viewed | |
| 22.16.12 Describe how the following factors affect stalling speed: | – | | Not Viewed | |
| 22.16.16 Explain the design measures taken to reduce the tendency for wing-drop. | – | | Not Viewed | |
| 22.16.18 Explain the caution against using aileron near or at the stalling angle | – | | Not Viewed | |
| 22.16.20 Describe the standard technique for recovery: | – | | Not Viewed | |
| 22.16.22 Explain the process of autorotation (leading to the spin). | – | | Not Viewed | |
| 22.16.24 Describe the characteristics of the upright spin, and explain: | – | | Not Viewed | |
| 22.18.4 For a conventional aeroplane configuration, describe: | – | | Not Viewed | |
| 22.18.8 For unaccelerated level flight: | – | | Not Viewed | |
| 22.18.10 Given typical power available and power required curves, exp | – | | Not Viewed | |
| 22.20.2 Identify the forces acting in a steady climb. | – | | Not Viewed | |
| 22.20.4 Given typical power required and power available curves, exp | – | | Not Viewed | |
| 22.20.6 State what the Vx and Vy speeds are and differentiate betwee | – | | Not Viewed | |
| 22.20.8 Define absolute ceiling and service ceiling. | – | | Not Viewed | |
| 22.20.10 Explain the factors affecting climb performance | – | | Not Viewed | |
| 22.20.12 Identify the forces acting in a glide and a steady power-on | – | | Not Viewed | |
| 22.20.14 Explain the connection between L/D ratio, glide angle, airspeed and gliding range | – | | Not Viewed | |
| 22.20.16 Describe the effect of: | – | | Not Viewed | |
| 22.22.8 Explain the connection between load factor and percentage increase in stalling speed | – | | Not Viewed | |
| 22.22.10 Explain the factors affecting rate and radius of turn. | – | | Not Viewed | |
| 22.22.12 Explain the conditions for a maximum rate/minimum radius turn | – | | Not Viewed | |
| 22.22.14 Explain the effect of wind during: | – | | Not Viewed | |
| 22.22.16 In climbing and descending turns, describe: | – | | Not Viewed | |
| 22.22.20 Identify the factors affecting the radius of a looping manoeuvre | – | | Not Viewed | |
| 22.22.22 Describe design manoeuvre speed (Va) and … | – | | Not Viewed | |
| 22.22.22 …. and explain the features of a typical V-n(or V-g) diagram | – | | Not Viewed | |
| 22.24.2 Define blade face, blade angle, pitch (or helix) angle, heli | – | | Not Viewed | |
| 22.24.4 Describe the forces acting on a propeller blade; the rpm/airspeed relationship; and the most effective blade sections | – | | Not Viewed | |
| 22.24.6 Explain how propeller pitch affects efficiency at different speeds | – | | Not Viewed | |
| 22.24.8 Explain the purpose of the constant-speed (variable pitch) propeller | – | | Not Viewed | |
| 22.24.10 Describe in broad terms the operation of the constant speed unit (CSU) with changes in power setting and airspeed. | – | | Not Viewed | |
| 22.24.12 Describe the correct procedure for handling manifold pressure and propeller controls. | – | | Not Viewed | |
| 22.24.14 Describe the forces acting on a propeller when: | – | | Not Viewed | |
| 22.24.16 Explain propeller centrifugal and aerodynamic twisting moments | – | | Not Viewed | |
| 22.26.2 Explain static stability and dynamic stability. | – | | Not Viewed | |
| 22.26.6 Define longitudinal stability and explain: | – | | Not Viewed | |
| 22.26.8 Define directional stability and explain the factors affecti | – | | Not Viewed | |
| 22.26.12 Explain the requirement to match lateral and directional sta | – | | Not Viewed | |
| 22.26.14 Explain the conditions of spiral instability, dutch roll, an | – | | Not Viewed | |
| 22.26.18 For a single-engine propeller aircraft, explain the factors | – | | Not Viewed | |
| 22.26.20 Describe cross-wind take-off and landing techniques. | – | | Not Viewed | |
| 22.26.22 Explain ground effect, and relate it to take-off and landing | – | | Not Viewed | |
| 22.28.2 Explain the consideration involved in coping with asymmetric | – | | Not Viewed | |
| 22.28.12 Define Vmca and Vmcg. | – | | Not Viewed | |
| 22.28.6 Define critical engine. | – | | Not Viewed | |
| 22.30.4 State the general conditions for achieving maximum SAR. | – | | Not Viewed | |
| 22.28.10 Explain the three modes of constant-heading asymmetric fligh | – | | Not Viewed | |
| 22.30.8 Apply performance tables or graphs from an aircraft manual to determine best SAR under given conditions. | – | | Not Viewed | |
| 22.30.6 Explain the airframe and engine considerations of flying for range (piston engine) | – | | Not Viewed | |
| 22.30.10 Define flying for endurance and differentiate between range | – | | Not Viewed | |
| 22.30.12 State the factors affecting endurance and explain practical endurance flying techniques | – | | Not Viewed | |
| TODR | – | | Not Viewed | |
| Flight paths | – | | Not Viewed | |
| Landing distance available | – | | Not Viewed | |
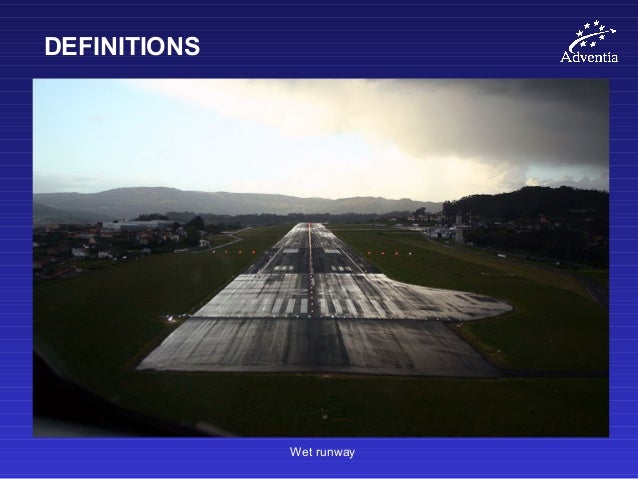
| Runway surface | – | | Not Viewed | |
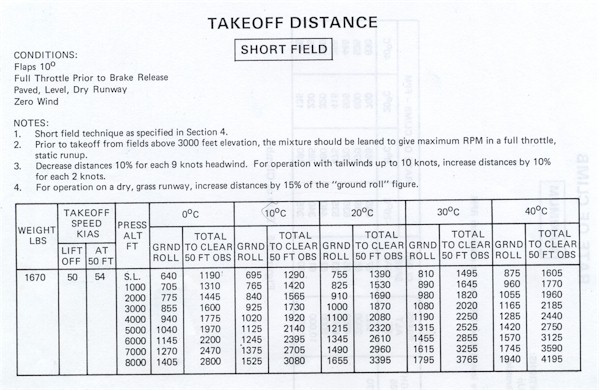
| 22.32.4 Explain the factors affecting take-off and landing performance | – | | Not Viewed | |
| 22.32.6 Given an elevation, QNH and ambient temperature, calculate p | – | | Not Viewed | |
| 22.32.8 Express an ambient temperature as a deviation from ISA temperature | – | | Not Viewed | |
| 22.32.10 Demonstrate an ability to use wind-component graphs, and to apply runway slope and surface correction factors | – | | Not Viewed | |
| 22.32.12 Demonstrate an ability to calculate take-off and landing performance in accordance with CAR Part 135 Subpart D using representative aeroplane take-off and landing performance charts (P-charts) | – | | Not Viewed | |
| 22.32.14 Demonstrate an ability to calculate en-route engine inoperative performance using a representative single-engine service ceiling graph | – | | Not Viewed | |