22.10.10
Explain form drag and state the factors affecting it.
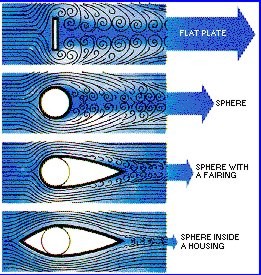
- Drag caused by the separation of the boundary layer from a surface and the wake created by that separation
- Component of profile drag
- Created by the pressure difference between forward and rearward facing surfaces
- Affected by the shape and size of the object, Angle of Attack, and speed
That part of the drag on an aerofoil which arises from its shape. It varies according to the angle of attack and can be decreased by streamlining.
It is affected by the shape the object presents to the airflow. As can be seen in the diagram below.
Streamlining, Size, Angle of Attack, Speed
Fineness ratio –
Angle of Attack – higher AofA, separation point moves forward and form drag increases,
22.10.8
Explain skin-friction drag and state the factors affecting it.
- Drag caused by the friction of air against the surface of an object moving through it
- Result of shear stress between successive layers of air
Friction Drag, also known as Skin Friction Drag, is drag caused by the friction of a fluid against the surface of an object that is moving through it. It is directly proportional to the area of the surface in contact with the fluid and increases with the square of the velocity. In aerodynamics, the fluid concerned is the atmosphere.
Factors affecting skin friction are
- Speed As speed increases the shear stress across the boundary layer increases. Skin friction increases as the square of the speed.
- Shape Laminar flow boundary layers are sensitive to pressure gradients, which occur when influenced by an area of higher static pressure.The lowest static pressure will be located at approximately the point of maximum airfoil thickness. As the flow continues aft static pressure rises and the airflow is unable to remain linear, so it gradually thickens and becomes turbulent. Laminar flow is also very sensitive to surface irregularities and roughness. If it can be felt under the hand it will affect laminar flow.
- Size For any given size of aerofoil of a given shape if airflow is increased there will be an increase in drag (and lift as it is an aerofoil); the increase in drag is out of proportion to the increase in size. If a shape is doubled the increase in drag and lift is more than doubled under the same conditions. This is called Scale effect and is measured by Reynolds Number. We won’t discuss Reynolds Number as it is a complex subject beyond the scope of these notes.
- Surface area The scale of skin friction drag depends on the wetted area of the aircraft. That is the total surface exposed to the airflow.
- Angle of attack High angles of attack will cause the low pressure peak over the wing to move forward and the transition region will also move forward in sympathy with the changed pressure gradient, creating a greater proportion of the surface subject to a turbulent boundary layer.
22.10.6
Describe:
(a) laminar boundary layer flow;
(b) turbulent boundary layer flow;
(c) transition region.
Laminar layer flow
- Laminar flow boundary layers are very thin (typically 2mm)
- Uniform increase in velocity from zero at the surface to freestream value at outer edge
- Slides smoothly over successive layers
Turbulent layer flow
- Turbulent flow boundary layers are typically 10 X thicker than the laminar flow (20mm)
- Characterized by high frequencies eddies and swirls with considerable intermixing of the flows at successive levels
Transition region
- Region at which the flow changes from laminar to turbulent
The laminar boundary layer flow is the region on the wing where the flow is laminar in nature, each successive layer slides smoothly over the one beneath it, there is a uniform increase in speed from zero to the freestream flow at the outer edge. This layer is typically 2mm in thickness
The turbulent boundary layer flow is the region where after flowing in a laminar way the flow breaks into a turbulent layer. This layer has high-frequency eddies and swirls and there is a lot of intermixing of flows at successive levels. This layer is typically 10 times the thickness of the laminar layer, approximately 20mm
Transition region is the region where the flow turns from laminar to turbulent. This occurs over a short distance.
22.10.4
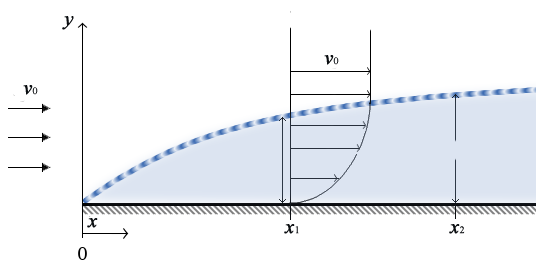
Explain the term boundary layer.
The boundary layer is a layer of retarded flow which is sandwiched between the local free stream flow and the surface of a body.
22.10.2
Identify and explain the components of total drag.
Total drag is made up of:
- Induced drag
- Parasite drag
Parasite drag is made up of
22.8.18
Define aspect ratio (AR) and describe the effect of AR on CL.
- Calculated by dividing the wingspan by mean aerodynamic chord
- or span2 divided by the gross wing area (A)

- High AR wing produces a higher CL for a given geometric A of A
- High AR wing stalls at a lower geometric A of A
CL vs Geometric Angle of Attack graph

Aspect ratio is the ratio of the wingspan to the chord of the wing. It is used to give a comparison between varying wing shapes.
Aspect ratio is often measured by span2 divided by the gross wing area (A), or wingspan divided by the mean aerodynamic chord. It includes any area ‘cut out’ by the fuselage.
It has an effect on CL due to the changes in the effective airflow. A high aspect ratio wing will meet its maximum CL at a lower angle of attack than when compared to a low aspect ratio wing. Although it may have a higher CL overall compared to a low aspect ratio wing. (see diagram below)
22.8.16
Explain the effect of induced downwash on α
- Created by the wingtip and trailing edge vortices
- Decreases effective A of A
- Tilts TR rearwards, resulting in a reduction of lift and increased induced drag
The higher the induced downwash, the smaller the effective angle of attack, the further tilted aft the Total Reaction will be and therefore the higher the induced drag will be.

22.8.14
Describe three-dimensional flow over a wing and explain how wingtip and trailing edge vortices are formed.
- Chordwise flow follows the camber of the wing
- A third dimensional flow travels the wing span
- Spanwise flow on top, moves from wing root to wing tip
- Spanwise flow on the bottom, moves from wing tip to wing root
- Wingtip vortices are caused by the air spilling from high pressure to low pressure around the wing tips
- Trailing edge vortices are caused by airflows meeting at the trailing edge at slightly different angles
When considering three-dimensional flow over a wing we need to consider spanwise flow. The air under the wing is at a higher pressure than the air on top and therefore air which obeys the gas laws will try to flow from high pressure to low pressure. This sets up a flow around the wing tips from beneath the wing to the top. As the two airflows come together at differing angles a vortex is formed.

22.8.12
With respect to the CL curve, describe the effect of:
(a) increased camber;
(b) surface roughness (e.g. contamination).
- As camber is increased, the wing will produce a higher CL
- As camber is increased, the wing will stall at a lower A of A
- As surface roughness is increased, CLmax is reduced
- As surface roughness is increased, the stall Angle of Attack is reduced
An increase in camber will increase CLat all normal operating angles of attack
An increase in surface roughness, especially over the first 20-30% of the wing will cause lift to break down at an earlier stage, effectively reducing CL.
22.8.10
Explain the meaning of a high CLmax.
- Produces more lift over all normal operating angles of attack
- Fly at slower speeds without stalling
- More manoeuvrable
All other factors being equal, a wing with a high CL max will produce more lift than a wing with a lower CL max. This means the aircraft with the higher CL max will be able to fly at a lower speed without stalling and has more manoeuvrability


