8.44.10 Interpret and assess weather information made available by: Internet, newspapers television, and radio.

Interpret and assess weather information made available by: Internet, newspapers television, and radio. 

Do an overview first of the weather chart
Identify the main features first
eg any depression, fronts – warm front , cold front

Anticipate the timing of fronts passing through based on the movement of air mass from West to East
Look for anticyclone features to the East of the country and ridges of high pressure

Pressure Trends
Look at the isobars – they relate to QNH at various places on the chart
Note the dfferences between the isobars

Wind Velocity
The wind blows parallel to isobars – clockwise around a low and anticlockwise around a high
Wind strength is related to the spacing of the isobars
A general impression can be obtained

Weather Systems
Pay close attention to highs lows and fronts
The degree of curvature of isobars at a cold front will indicate the severity of the front
Lowering cloud base and rain are to be expected with the approach and arrival of a warm front

8.44.8 Meteorological Services

With respect to NZ FIR VFR operations, interpret, understand and assess information of all the descriptions contained in the following; 
a)  area forecast (ARFOR); 
b)  meteorological reports (METAR/SPECI/ METAR AUTO); 
c)  trend forecasts (TREND); 
d)  aerodrome forecasts (TAF); 
e)  SIGMET; Advisory Circular AC61-3 Revision 19 17 May 2013 51 CAA of NZ Sub Topic Syllabus Item 
f)  Automatic terminal information service (ATIS); 
g)  Aerodrome and weather information broadcasts (AWIB); 
h)  Basic weather reports (BWR); 
i)  Pilot reports; 
j)  Radar and Satellite imagery. 

a) ARFOR 

This is a forecast for a specified area and is intended for those planning domestic flights up to 10,000 feet
There are 17 Forecast areas in NZ
Each is identified by a name not specific to a province or to a prominent city within the area

Consists of

– Issue Time
– Maximum and Minimum QNH
– Landing Forecast

b) METAR / SPECI – for main / military airports
    METAR AUTO – all remaining airports

c) TREND

This is a Landing Forecast
Appended to a METAR or SPECI from an International airport
Also appended to the reports from military airports
The period of Landing Forecast is 2 hours
Not appended to METAR Auto reports
Recent Weather
Wind Shear

d) TAF

These are four specified periods, which are prepared and distributed in the TAF code.
A TAF covers the airspace within a radius of 8 kms from the Reference Point of the aerodrome
Issued every 6 hours starting at 0000 UTC

Should be issued at least 2 hours before their period of validity commences
During Daylight Saving the UTC issue time is put back one hour so the same local time applies throughout the year

Contains:
– Date and Time of Issue
– Date and Period of Validity
– Surface Wind
– Visibility
– Expected Weather Conditions
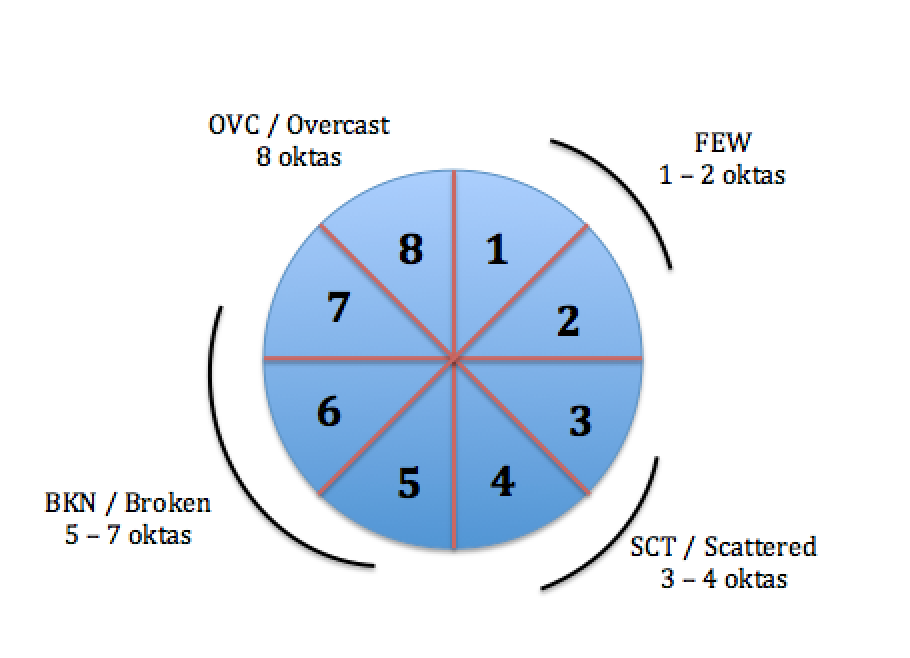
– Cloud Amount Height of Base
– Change Groups
– Probable Changes
– 2000ft Wind
– Missing TAF
– Maximum and Miniumum QNH
– Landing Forecast

e) SIGMET

This is issued for potentially hazardous weather conditions in the NZ domestic FIR and Auckland Oceanic FIR
Has a validity of 4 hours
In the case of volcanic ash or tropical cyclones the period is 6 hours

Reason for issue of a SIGMET
– Thunderstorms, obscured, embedded, frequent or in a squall line with or without intense hail
– Severe icing – in cloud due to freezing rain
– Tropical cyclone
– Heavy sand or dust storm
– Volcanic ash cloud

When the SIGMET is issued it is included in pre-flight information and passed to all affected aircraft
SIGMET have serial numbers and after 0000 UTC goes back to 01

f) ATIS

ATIS contains Take-off and Landing reports including the following:
– location and ATIS designator
– time of issue
– runway in use
– wind direction in degrees Magnetic and speed in knots
– visisbility reported in metres up to 4900m and kilometres from 5 kms
– low cloud in feet above aerodrome elevation
– present weather if significant
– temperature, dew point and QNH
– Other – wind shear, turbulence, type of approach etc
– reported or forecast 2000 ft wind

g) AWIB

This is an automatic broadcast of operational and weather information at unattended aerodromes.
Similar to the ATIS
The reports are prepared by local pilots or other people with meterological knowledge
The frequency for the AWIB is published on the Aerodrome chart – sometimes needs to be triggered by the aircraft radio transmitter

h) BWR

This is a verbal report on the actual weather conditions at a given place – usually a non attendance aerodrome
Personnel must be trained appropriately and have the skills to provide the report and ensure all equipment used is properly calibrated and maintained

BWR contains:
– wind direction in Magnetic degrees
– QNH
– ambient air temperature
– weather conditions and cloud cover

BWR must not take the place of a METAR or SPECI

I) Pilot Reports (PIREP)

Also called Aircraft Reports (AIREP)

Must report turbulence and icing especially if severe – report to nearest ATS

Regardless if other pilots have reported same or SIGMET already issued

Must also report :

Wind Shear – report height or height band the wind structure above and below the shear zone the magnitude of the associated temperature inversion and effect o the aircraft such as air speed change or drift changes etc

Volcanic Ash Reports

– give location of volcanic activity, air temperature, spot wind and horizontal and vertical extent of ash cloud

Severe Mountain Wave

Thunderstorms without hail

Thunderstorms with hail

Heavy dust / sandstorm

j) RADAR and Satellite Imagery

Often referred to as synoptic charts; can be drawn for various altitudes but most commonly shown as MSL (mean sea level) charts. 

Radar synoptics show an overview of weather systems, which gives you a better appreciation and understanding of what weather systems are doing, and how they may affect us as pilots. 

8.44.6 Describe the principle of operation, and operational effectiveness of the automated visibility sensor

Describe the principle of operation, and operational effectiveness of the automated visibility sensor

A visibility sensor measures the visibility in the immediate vicinity of the sensor probe – not the whole sky

The common sensor used is the Valsala Laser Ceilometer – installed at busy airports in NZ

Using inputs from a low powered infra-red laser beams the cloud base is continually monitored by analysing the echo reflected back from the cloud

The system can detect multiple cloud layers, rain, snowfall and fog

When visibility data from an electric sensor are received by a pilot, they should consider the fact that this is the visibility data for the immediate area and other areas around the aerodrome could be vastly different.

Always treat this data with caution

8.44.4 Describe how cloud and cloud base are reported.

Describe how cloud and cloud base are reported.

Cloud cover is reported in the Amount mode – not in the Type mode
NSC – No Signifiant Cloud
FEW – 1-2 oktas
SCT – 3-4 oktas
BKN – 5-7 oktas
OVC – 8 oktas
CAVOK – Ceiling and Visibility OK

Cloud base is reported as a 3 figure number in feet above aerodrome level

SCT016 – means 3-4 oktas of cloud with a base of 1600 ft agl (above ground level)

BKN040CB – means 5-7 oktas of cumulonimbus with a base of 4000ft agl

8.44.2 Descriptions of Cloud Coverage

With reference to cloud amount, explain the meaning of:
a)  SKC; 
b)  NSC; 
c)  FEW; 
d)  SCT; 
e)  BKN; 
f)  OVC; 
g)  CAVOK. 

a) SKC – Sky Clear

b) NSC – No Significant Cloud

c) FEW  – 1-2 oktas

d) SCT – 3-4 oktas

e) BKN – 5-7 oktas

f) OVC – 8 oktas

g) CAVOK –  “Ceiling and Visibility are okay”

 – This is used when the visibility is 10 km or more,

 – there is no cloud below 5000ft  – (or below the minimum sector altitude [ IFR] )  

 – no CB or TCU  (cumulonimbus and towering cumulus without anvil respectively)

 – no precipitation and no thunderstorms

* One okta is 1/8th of the sky covered , ie 4 oktas is about half the sky cloud covered and 8 oktas is completely overcast

(k) Pilot Reports.

Include PIREPS and AIREPS, these are an important part of the weather system

 – good feedback from pilots provides better information for other pilots

– all pilot reports are passed back to Metservice and if severe weather was encountered there may be a SIGMET issued

– any information is good and able to be put to use

(j) BWR;

Basic Weather Reports

 – Verbal weather reports passed to pilots from non-certified observers near an airfield or other place such as a mountain pass

 – If provided through UNICOM or ATS operator the report can be relied upon as it is accurate

(i) AWIB;

Aerodrome and Weather Information Services

Operated in a similar manner to ATIS – except they are non-certified and the information transmitted is recorded automatically

AWIB are advisory only – should not be relied upon as information may be coming from multiple non-certified private sources

(h) ATIS;

Weather (MET) Card August 2017


 ATIS

The ATIS is a continuous
plain language broadcast of the current conditions at an aerodrome, on a
discrete frequency.

Issue times

Irregularly, when
conditions change or deteriorate

Heights

Feet above aerodrome
level

Wind

Speed

Knots

Direction

Degrees magnetic


Visibility

Less than 5000 metres –
in metres, eg 3000

5000 metres or more – in
kilometres, eg 5KM

Cloud

Type

CB, TCU

Amount

SKC, FEW, SCT, BKN, OVC


Temperature/ Dew Point

Degrees Celsius

Pressure (QNH for ATIS only)

Hectopascals (hPa)


(g) SIGMET;

Weather (MET) Card August 2017


 SIGMET

SIGMETs provide
information on observed or forecast hazardous weather conditions.

Issue times

As required

Validity

Four hours (six hours
for volcanic ash and tropical cyclones), reviewed after three hours or when
further information available

Heights

Feet above mean sea
level up to 10,000 feet, flight levels from FL 100

Area

New Zealand FIR (NZZC)
and Auckland Oceanic FIR (NZZO)